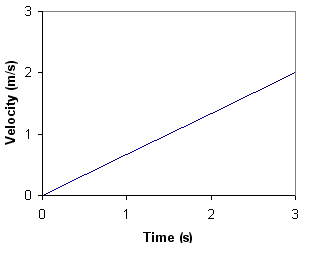
In this section, we are going to learn how a velocity- time graph can tell us the displacement of an object. Now both velocity and displacement have directions. This can make things complicated. So to make it easier to learn about this, lets just think about them like speed and distance, and ignore the direction at first.

Lets look at this speed-time graph and think about how it can tell us what the distance is. The graph tells us that the object, whatever it is, moved at the speed of 2 m/s for a time of 3 s. Once we are clear about this, we don't really need the graph any more. Just use:
distance = speed x time
So distance = 2 x 3 = 6 m. Simple. Now lets take a look at the graph again. Can you see a rectangle under the graph (line)? The height of this triangle is 2, and the base is 3. 2 x 3 happens to be the area of this rectangle. With some imagination, you can see that the distance is always equal to the area under this graph, even if the speed and time are different. This is assuming, of course, that the speed remains the same.
What if it does not. Suppose the speed increases with time like this.
The graph goes up in a straight line. We say that the speed increases uniformly. Every second, the speed increases by the same amount. How are we going to find the distance in this case? You see the triangle under the graph (slanted line)? I am going to ask you to take a leap of imagination now, and tell you that the distance is the area of this triangle.
This is not so easy to understand as the rectangle earlier. Unfortunately, I am going to have to ask you to just accept it, as the reason is not covered in A level physics. We can still learn to use the idea anyway. So lets find this area. The area of a trangle is given by the formula
area = 1/2 x base x height
Therefore the distance = 1/2 x 3 x 2 = 3 m.
Now that we are quite comfortable with finding distance from the area, let us now move on to full fledged velocity and displacement. Lets make life more difficult and put in the direction.
Lets look at the familiar example of a ball rolling up the slope, and the velocity-time graph that looks like this.
We need to think about finding displacement from this graph. Lets start with the easy bit. Lets look at the part of the graph between 0 and 2 s. On this part of the graph, the velocity has + sign. As long as the ball is going in the same direction. we can treat it as a simple speed-time graph, and not worry about the direction. Then we can find the distance by finding the area in the triangle between 0 and 2 s. That would be
area = 1/2 x base x height = 1/2 x 2 x 2 = 2 m
This tells us that the displacement of the ball is +2 m, or 2 m up the slope.
Next, we turn our attention to the time from 2 to 4 s. Since the velocity here has - sign, it means the ball is rolling down the slope. That is the job of hte - sign, to tell us the direction. Since it is going in the same direction during this time from 2 to 4 s, we can find the distance from the area. If you are quick to notice this area is symmetrical with the area from 0 to 2 s, then you already have the answer. It is 2 m. So the displacement is -2 m, or 2 m down the slope.
Lets summarise:
0 to 2 s, displacement is +2 m
2 to 4 s, displacement is -2 m
So what is the displacement from 0 to 4 s? If you think that it is zero, then you are right. 2 m up, 2 m down, the ball is back where it started.
Tip: No matter how the ball moves over a period of time - up, down, left, right - the displacement is the straight line distance from start point to end point, and the direction is the direction of this straight line.


No comments:
Post a Comment